How to Read Cycling Power Data: A Complete Guide to TSS, IF and NP
You just finished a grueling interval session, downloaded your ride data, and now you’re staring at a screen full of numbers. Average power? Check. Max power? Got it. But what about those mysterious acronyms like TSS, NP, and IF? If you’ve invested in a power meter but feel like you’re only scratching the surface of what your cycling power data analysis can tell you, you’re not alone. Understanding these metrics is the difference between just collecting data and actually using it to get faster, stronger, and smarter on the bike.
Understanding the Foundation: What Cycling Power Data Actually Tells You
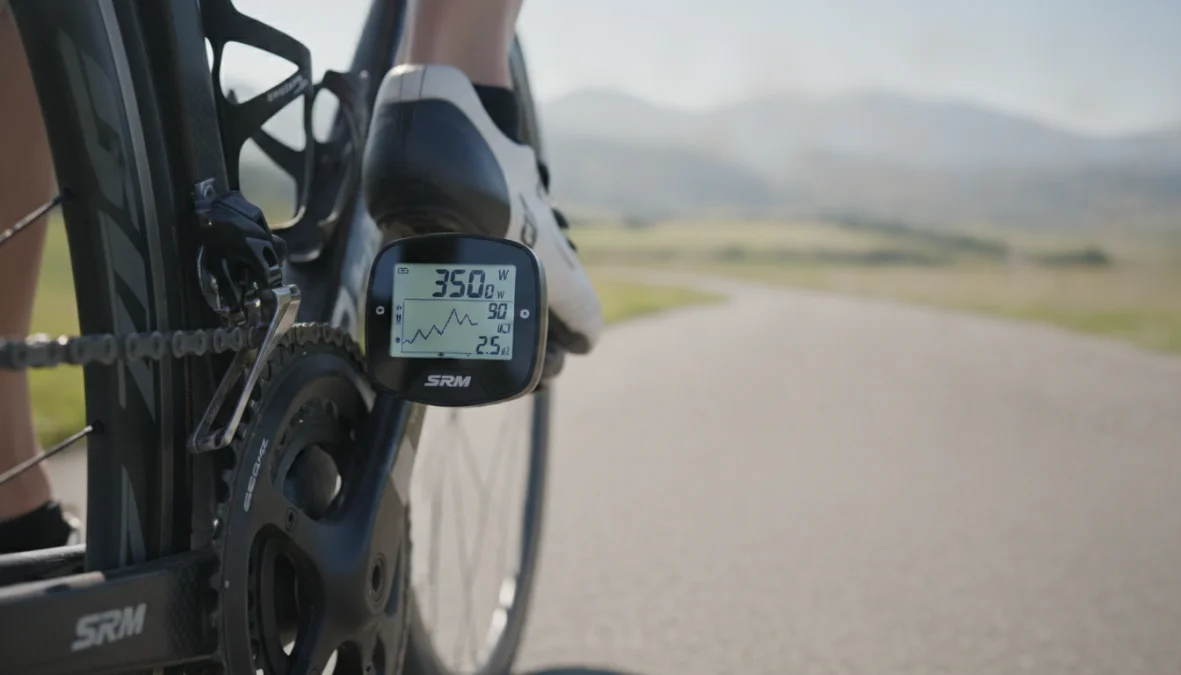
Unlike heart rate, which lags behind your actual effort and gets affected by caffeine, sleep, and stress, power meter data analysis gives you instant, objective feedback about your performance. Every pedal stroke generates watts, and those watts don’t lie. But raw power numbers alone won’t make you faster—you need context.
That’s where Functional Threshold Power (FTP) comes in. Your FTP represents the highest average power you can sustain for roughly an hour, and it serves as your personal baseline for all other cycling performance metrics. Think of it as your reference point—the number that makes all other numbers meaningful. If you’re new to power-based training, check out our comprehensive guide to training with power meters to establish your FTP correctly.
Once you have your FTP nailed down, three metrics become your training companions: Normalized Power (NP), Intensity Factor (IF), and Training Stress Score (TSS). Together, they answer three critical questions: How hard did you actually work? How intense was the effort relative to your ability? And how much stress did this workout place on your body? Master these, and you’ll unlock a whole new level of FTP analysis and training intelligence.
The Three Essential Power Metrics Every Cyclist Should Know
Let’s break down the holy trinity of power zone training metrics. These three numbers work together to give you a complete picture of every ride, from easy recovery spins to lung-busting race efforts.
Normalized Power (NP): Why Average Power Doesn’t Tell the Whole Story
Here’s a scenario: You ride two one-hour sessions, both with an average power of 200 watts. One was a perfectly steady tempo effort. The other was a brutal interval session with 30-second sprints followed by easy spinning. Your average power says they’re identical, but your legs know better. That’s the problem with average power—it treats all efforts equally when your body definitely doesn’t.
Normalized power cycling solves this by accounting for the physiological cost of variable efforts. When you’re asking what is normalized power in cycling, think of it as a weighted average that recognizes hard efforts hit your body harder than easy ones. The algorithm (developed by Dr. Andrew Coggan) uses a 30-second rolling average to capture the metabolic demands of intensity changes.
The difference between average and normalized power becomes obvious in races or interval sessions. A criterium race might show 180 watts average but 240 watts normalized—that 60-watt gap tells you there were lots of surges and accelerations. On a steady endurance ride, average and normalized power should be nearly identical. A big gap? That’s your clue about how variable the effort was, which leads us to the variability index (NP divided by average power).
Intensity Factor (IF): Measuring How Hard You Actually Worked
Now that you understand NP, intensity factor cycling becomes beautifully simple. It’s just your Normalized Power divided by your FTP, giving you a ratio that shows exactly how hard you worked relative to your threshold. If you’re wondering how to interpret intensity factor, here’s your reference guide:
- IF 0.50-0.65: Recovery and easy endurance rides
- IF 0.65-0.75: Aerobic endurance, the bread and butter of base training
- IF 0.75-0.85: Tempo efforts, comfortably hard
- IF 0.85-0.95: Threshold work, sustainable discomfort
- IF 0.95-1.05: VO2max intervals, properly hard efforts
- IF 1.05+: Race efforts or anaerobic work
The beauty of IF for FTP analysis is its simplicity. A 45-minute threshold session should target an IF around 0.95. A three-hour endurance ride? Aim for 0.65-0.70. Going above 1.0 on group rides? You’re probably working too hard if it’s supposed to be an easy day. This metric keeps you honest about whether you’re actually training in the intended zone.
Training Stress Score (TSS): Quantifying Your Training Load
The training stress score is where intensity meets duration. When you’re calculating training stress score for cyclists, the formula combines IF and ride time to give you a single number representing total workout stress. An hour at exactly your FTP (IF of 1.0) equals 100 TSS by definition.
Here’s your practical TSS guide for cycling performance metrics:
- Under 150 TSS: Low stress, you’ll recover quickly
- 150-300 TSS: Moderate stress, needs a recovery day afterward
- 300-450 TSS: High stress, expect 2+ days for full recovery
- 450+ TSS: Very high stress, typically only seen in long races or epic rides
For context: A 90-minute sweet spot workout (IF 0.88) delivers about 100 TSS. A five-hour endurance ride (IF 0.70) might accumulate 245 TSS. A criterium race lasting 90 minutes (IF 1.05) could hit 140 TSS. The magic of TSS is it lets you compare completely different workouts using a single metric. This becomes crucial when tracking chronic training load (your fitness) and acute training load (your fatigue)—concepts used in platforms like Training Peaks WKO for performance management.

Putting It All Together: How to Use TSS, NP and IF for Better Training
Raw data means nothing without interpretation. Here’s how to apply cycling power data analysis to actual training scenarios.
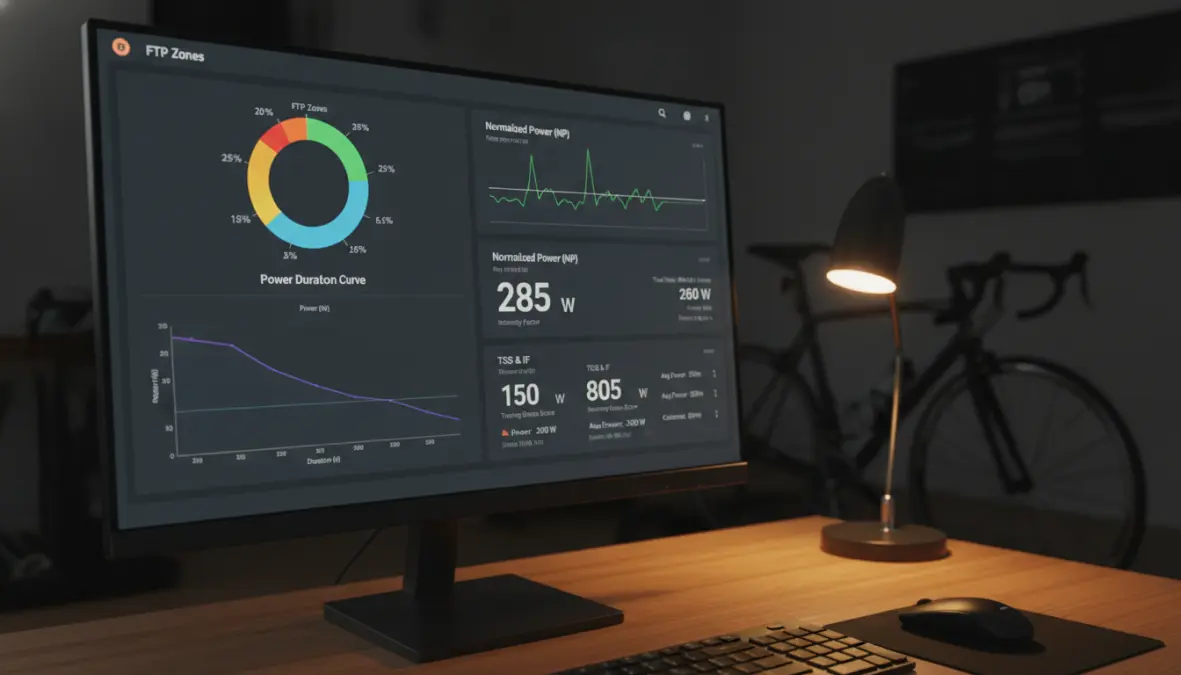
After every ride, check these three numbers together. A Tuesday interval session shows NP of 285 watts, IF of 0.95, and TSS of 85. Translation: You nailed threshold intensity for about 90 minutes—exactly what the workout called for. Now compare that to Sunday’s four-hour group ride: NP 195 watts, IF 0.65, TSS 190. Lower intensity but higher stress due to duration. This is power meter data analysis in action.
For weekly planning with power zone training, aim for a sustainable TSS total. Beginners might handle 300-400 TSS per week, while experienced riders can push 600-800. Going beyond your norm for too many weeks leads to overtraining. Track your weekly TSS and notice when fatigue accumulates. Proper bike positioning helps you maintain power output efficiently—our bike fitting guide explains how position impacts your power delivery.
Common mistakes? Chasing high IF on every ride (easy days should stay easy), ignoring the NP-to-average-power gap (tells you about pacing efficiency), and accumulating too much TSS without adequate recovery. Your power duration curve and power profile analysis can reveal whether you’re a sprinter or time trialist, helping you target the right training adaptations. Complement your power work with proper strength training to build the muscular foundation for higher FTP.
Don’t forget nutrition plays into your power output too. Strategic fueling affects your ability to hit target watts—learn more about carb cycling strategies to optimize energy availability for hard training blocks.
FAQ: Common Questions About Cycling Power Data
What’s a good weekly TSS target? For most amateur cyclists, 300-600 TSS weekly provides solid training stimulus without overload. Competitive riders might hit 700-1000 TSS. Start conservative and build gradually—a 5-10% increase per week is sustainable. Understanding power meter data analysis for beginners means not doing too much too soon.
How often should I test FTP? Every 6-8 weeks during build phases, or when workouts consistently feel too easy or hard. Your FTP changes with fitness, and outdated numbers throw off IF and TSS calculations. Proper testing requires fresh legs, so schedule it after a recovery week.
Can Normalized Power be higher than my maximum power? No, that’s impossible. NP smooths out variability but can’t exceed actual peak power. If you see this, there’s a data error or calculation glitch—check your power meter calibration.
Why is my IF always low even when I feel like I’m working hard? Either your FTP is set too high (inflating the denominator), or you’re better at short punchy efforts than sustained power. Test your FTP properly—20-minute tests or ramp tests work well. Your critical power curve can reveal if you’re more anaerobically gifted.
Does TSS work for indoor training? Absolutely. TSS is TSS whether you’re on the road or trainer. Indoor rides often show higher NP because there’s no coasting—you’re pedaling constantly. This makes interval work particularly effective indoors. When you’re ready to take that fitness outside, our indoor-to-outdoor transition guide helps you adapt.
Should I focus on increasing average power or normalized power? For steady efforts like time trials, they should align—work on both. For races with surges, focus on NP since it better represents metabolic cost. Improving your climbing power often means sustaining higher normalized watts on variable terrain.
Understanding TSS, IF, and NP transforms your training from guesswork into science. These metrics give you the language to describe workouts precisely, track progress objectively, and make smarter decisions about when to push and when to rest. Your power meter generates the data—now you have the tools to turn those numbers into real performance gains. Start with proper FTP testing, learn to read the story your post-ride numbers tell, and watch your cycling evolve from simply riding to intelligently training.